
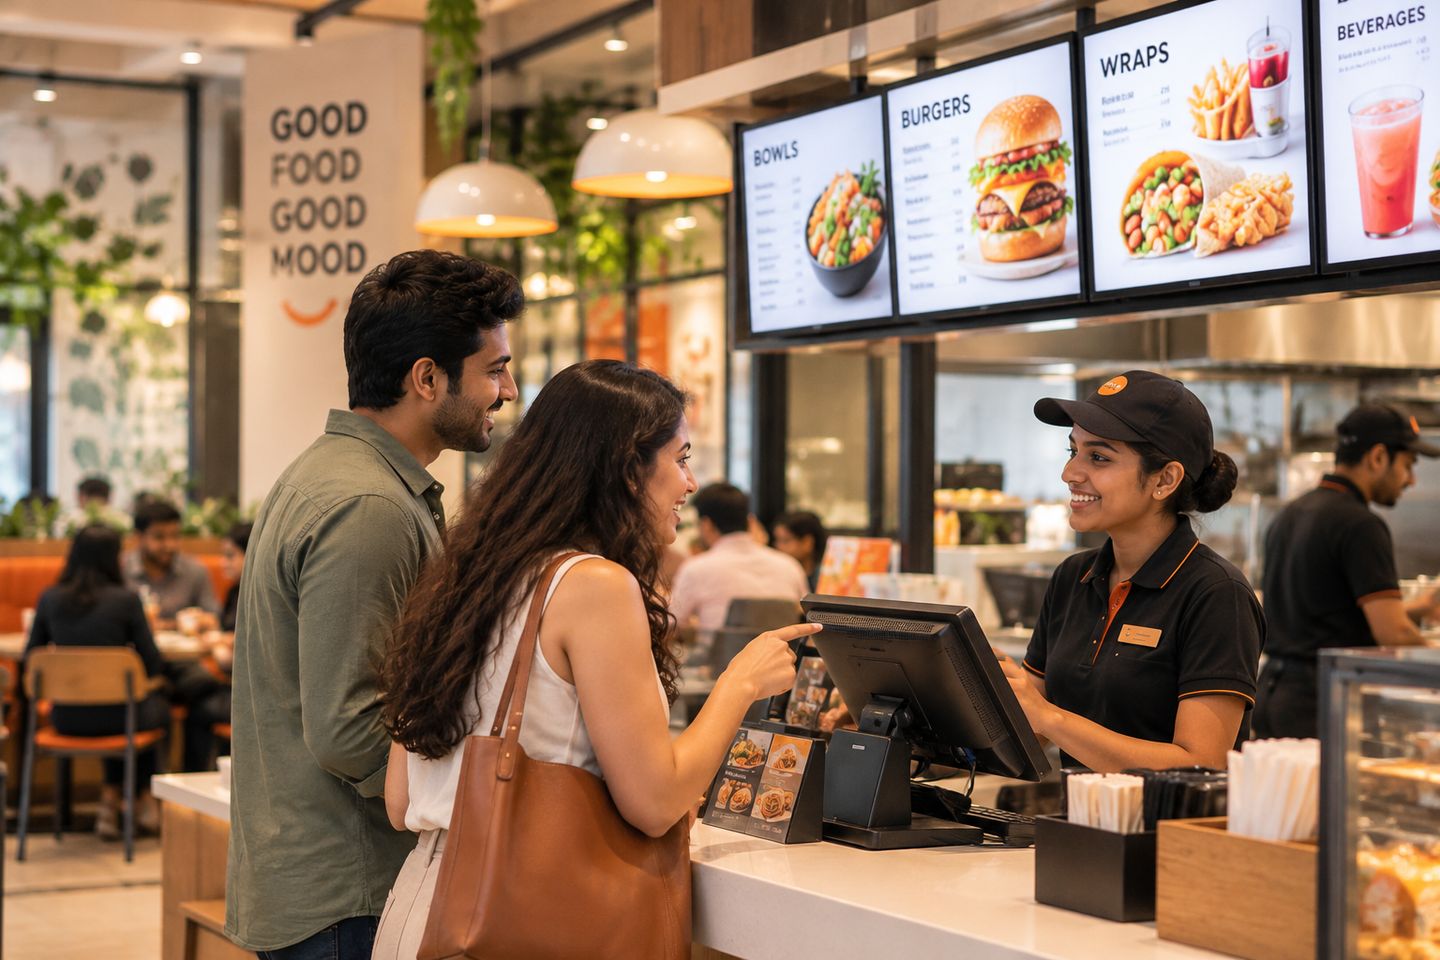
Retail and quick-service restaurant (QSR) customers rarely follow a straight line. A shopper might discover a product on Instagram, check the price on an app, visit the store to try it, and finally buy online for home delivery. A diner might browse a menu on a delivery platform, walk into the outlet instead, and then leave a review that influences hundreds of others. Each step shapes how the brand is remembered.
Journey mapping helps retail and QSR brands see that full path and find where it leaks customers.
Key stages in a retail or QSR journey
- Discovery. Ads, social media, influencers, store frontage, delivery-app listings.
- Consideration. Checking prices, menus, offers, reviews and stock availability.
- Visit or order. Parking, entry, store layout, queue time, digital ordering.
- Service interaction. Greeting, product knowledge, recommendations, order accuracy, speed.
- Payment. Billing speed, payment options, offer application, receipts.
- Fulfilment. Packing, takeaway handover, delivery time and condition.
- After the purchase. Returns and exchanges, feedback, loyalty programmes, repeat visits.
Common friction points
- Online and offline that do not match. Prices, offers or stock shown online are different in store.
- Inconsistent service across outlets. The flagship store delights, while smaller outlets fall short of the same standard.
- Peak-hour pressure. Long queues at billing or the order counter, and mistakes in orders when staff are rushed.
- Weak product knowledge. Staff who cannot answer basic questions or suggest alternatives.
- Difficult returns. A painful exchange process can erase the goodwill from an otherwise good purchase.
Making the map useful
Map by format and channel. A high-street fashion store, a supermarket, a mall food court outlet and a delivery-only kitchen each have different journeys. Map the ones that matter most to revenue first.
Measure consistency, not just averages. National averages can hide outlets that consistently underperform. Mystery shopping and store audits across locations show where standards slip and why.
Connect front-of-house to back-of-house. Long waits at the counter often trace back to kitchen workflow, staffing or stock replenishment. A service blueprint links the customer’s frustration to its operational cause.
Close the loop with frontline teams. Share findings outlet by outlet, recognise teams that deliver, and coach where needed. Journey maps work best when store managers can see their own part in the picture.
What good looks like
The retail and QSR brands that win repeat visits make every step feel easy: accurate information online, a warm and knowledgeable welcome in store, fast and correct orders, simple payments and painless returns. Journey mapping, backed by real evidence from every outlet, is how they find and fix the gaps, one visit at a time.
Want this evidence for your brand? Talk to our team about a study scoped to your customers, channels and goals, or write to growth@bridgeloyalty.com.